Last month we took a look at where the forest inventory data in the Southern Timber Supply Analysis application comes from and the process to get it in a form the app can use. But what happens when you actually run an analysis in the app – what is happening behind the scenes when you hit the “Summary Statistics” button?
Before you can calculate statistics, you need to define the supply area. You do this by choosing a radius or trucking time to calculate from a geographic location of your choice. If you choose a radius, a geodesic buffer is calculated around your point. If you choose a trucking time, we use Esri’s service areas geoprocessing service to calculate the supply area.
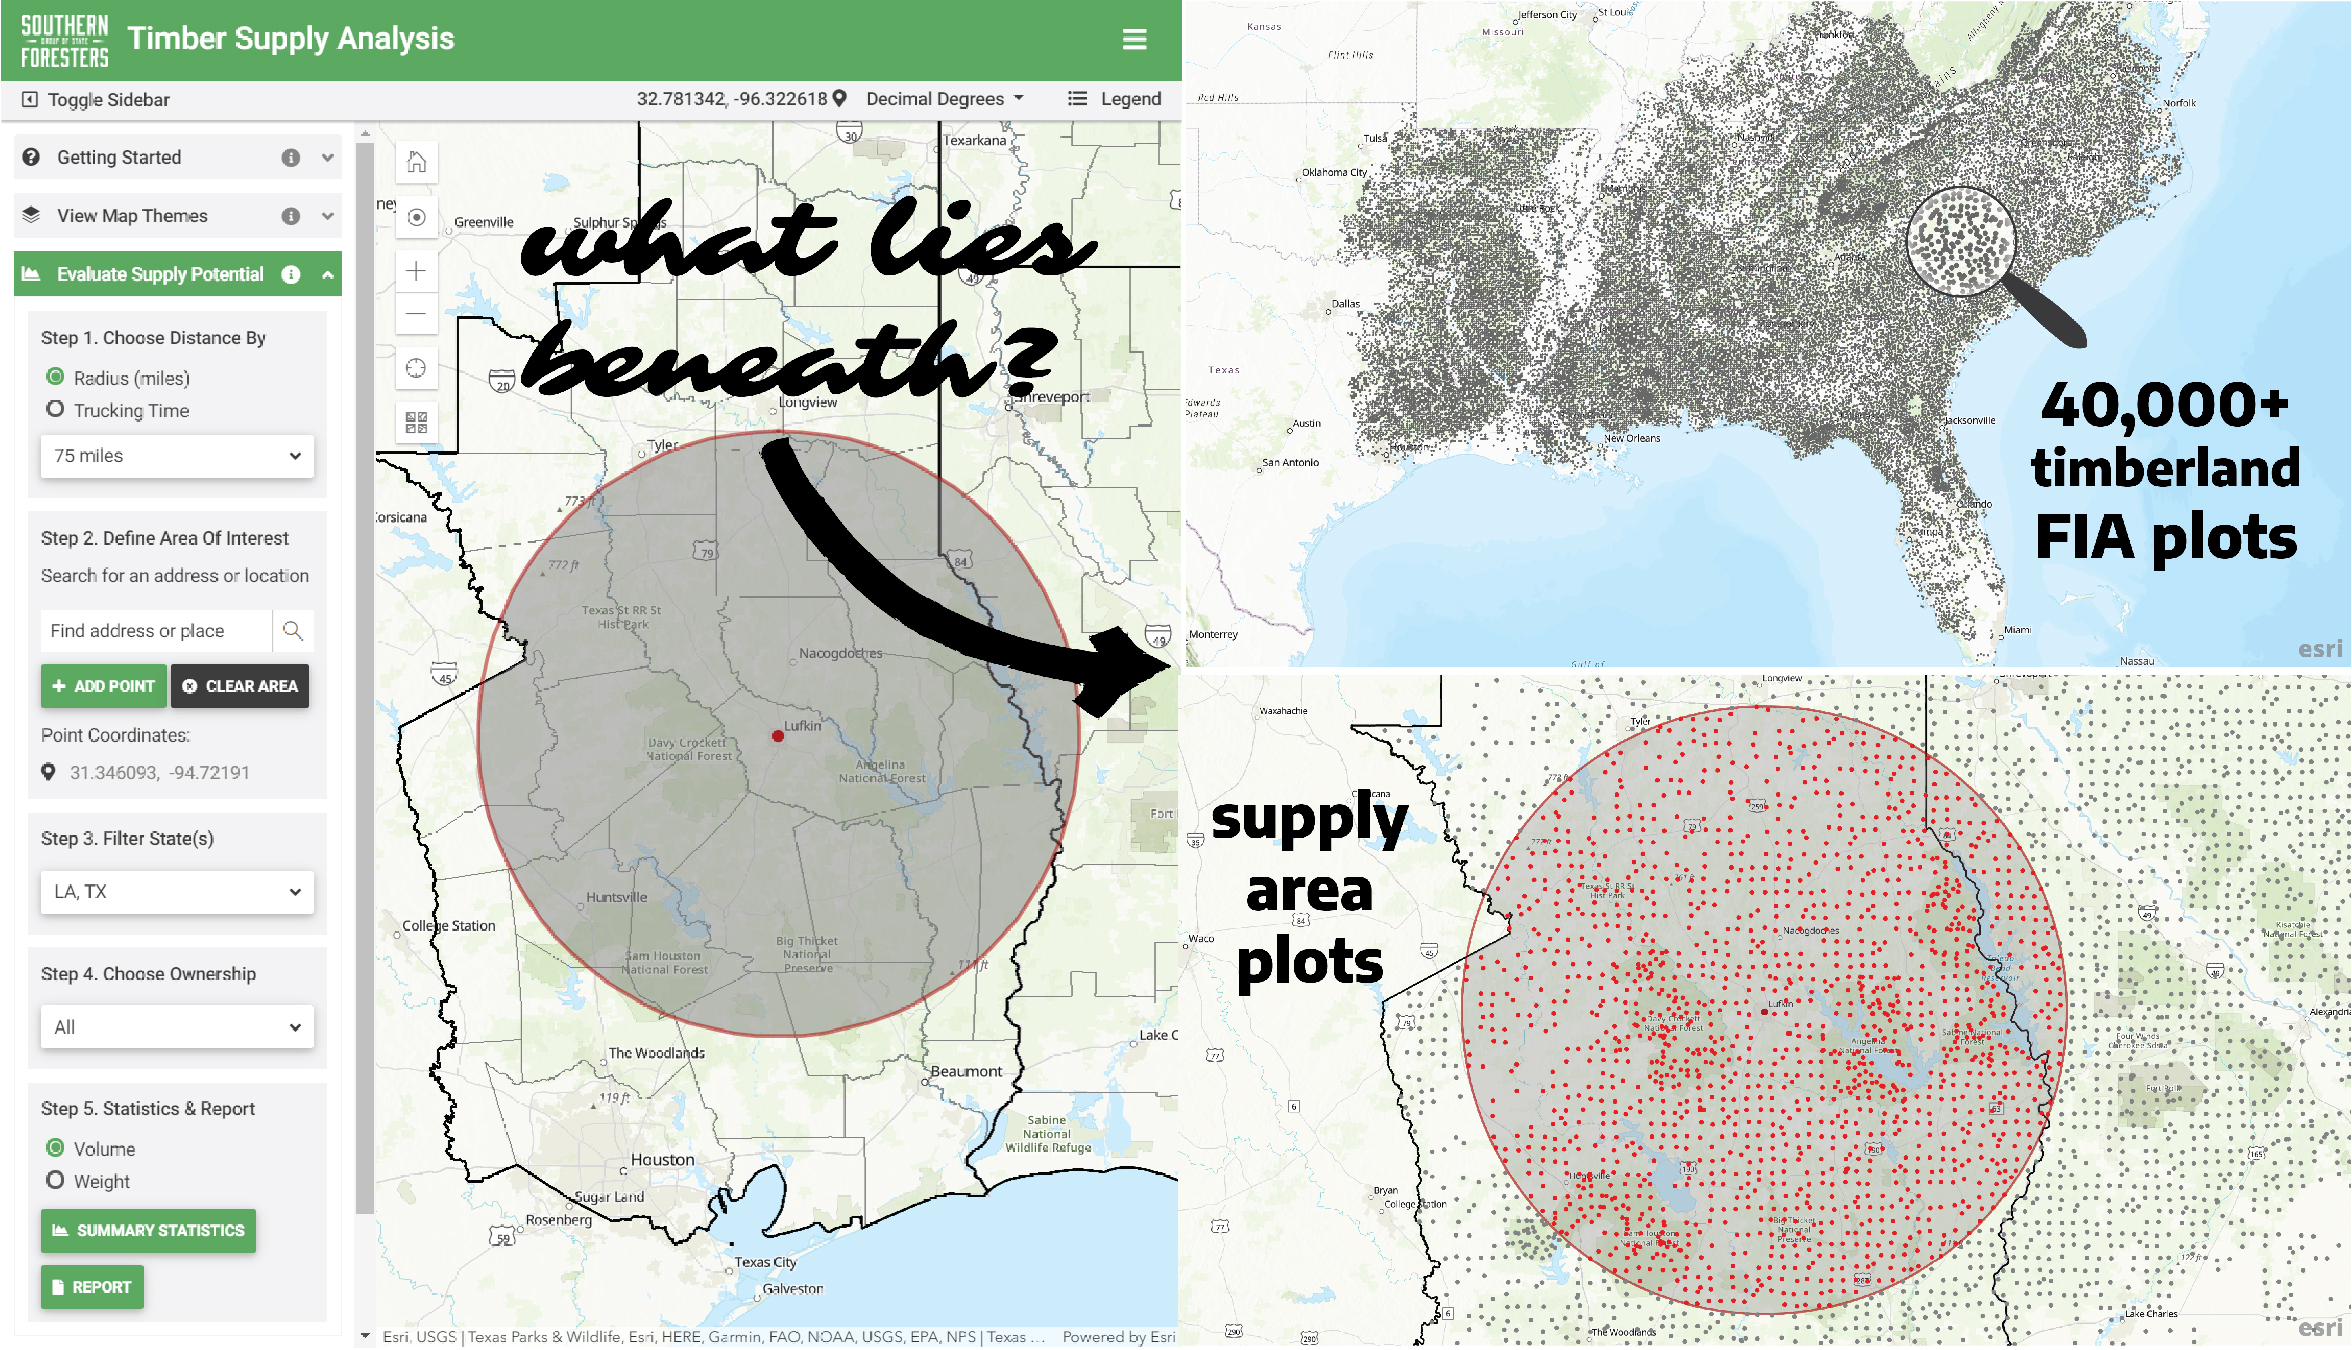
Once you have a supply area, when you click the “Summary Statistics” button, a spatial intersection between the supply area and all the FIA plots in the SQL Server database (see last month) is calculated to select just the plots within the supply area. The estimates for those plots are summed up, and voila! you have your summary statistics for your custom supply area. If a state or ownership filter was applied, we remove the appropriate plots before summing.