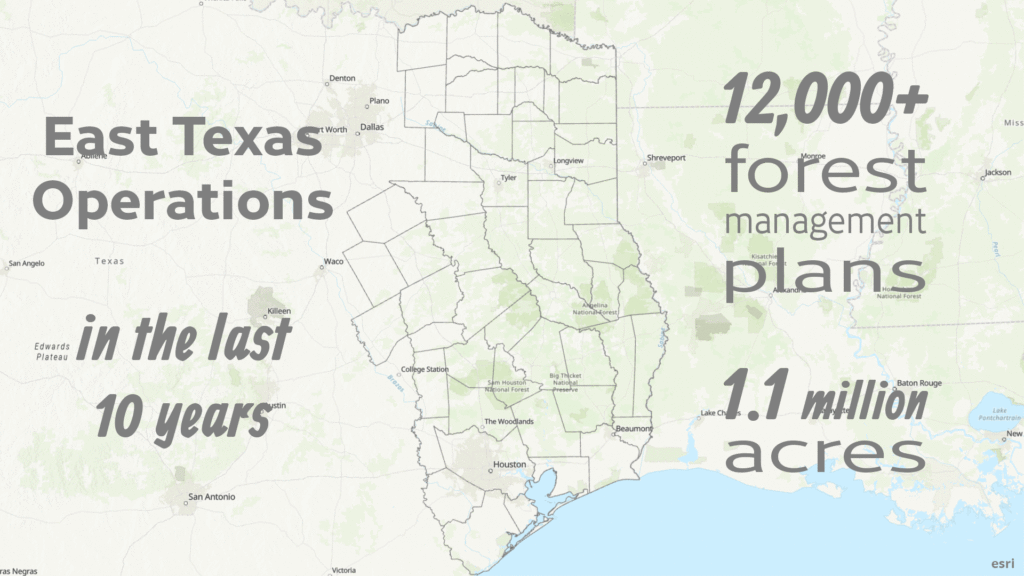
Foresters in East Texas help landowners develop forest management plans to sustainably manage their forestland. I created this animation to visualize the impact of their work over the last 10 years.
We have an internal tracking system to keep information on all the management plans our foresters create. This includes spatial data, which I pulled from the database along with the plan dates. The spatial data are polygons, so I converted the polygons to points to work well with the scale of all of East Texas. Each point represents one plan. Next, I worked on the animation part. The animation need to be only a few seconds long. With over 12,000 plans, I decided the best effect would be starting with a sprinkling of plans and then speeding up. To accomplish this with ArcGIS Pro’s animation tools, I needed to create a new date field and adjust the dates to be more spread out at the beginning and closer together at the end. I used a formula in Excel to do that, keeping the plans in their original chronological order. I set up the animation in ArcGIS Pro using my calculated date field and exported it as a gif.

There are a couple different kinds of management plans we do. This animation includes both stewardship and non-stewardship forest management plans. The non-stewardship plans only have spatial data going back to 2016, so points before then aren’t shown. They are included in the number of plans and acres, though. The time period is fiscal years 2010 through 2019 (October 2010 through September 2019).