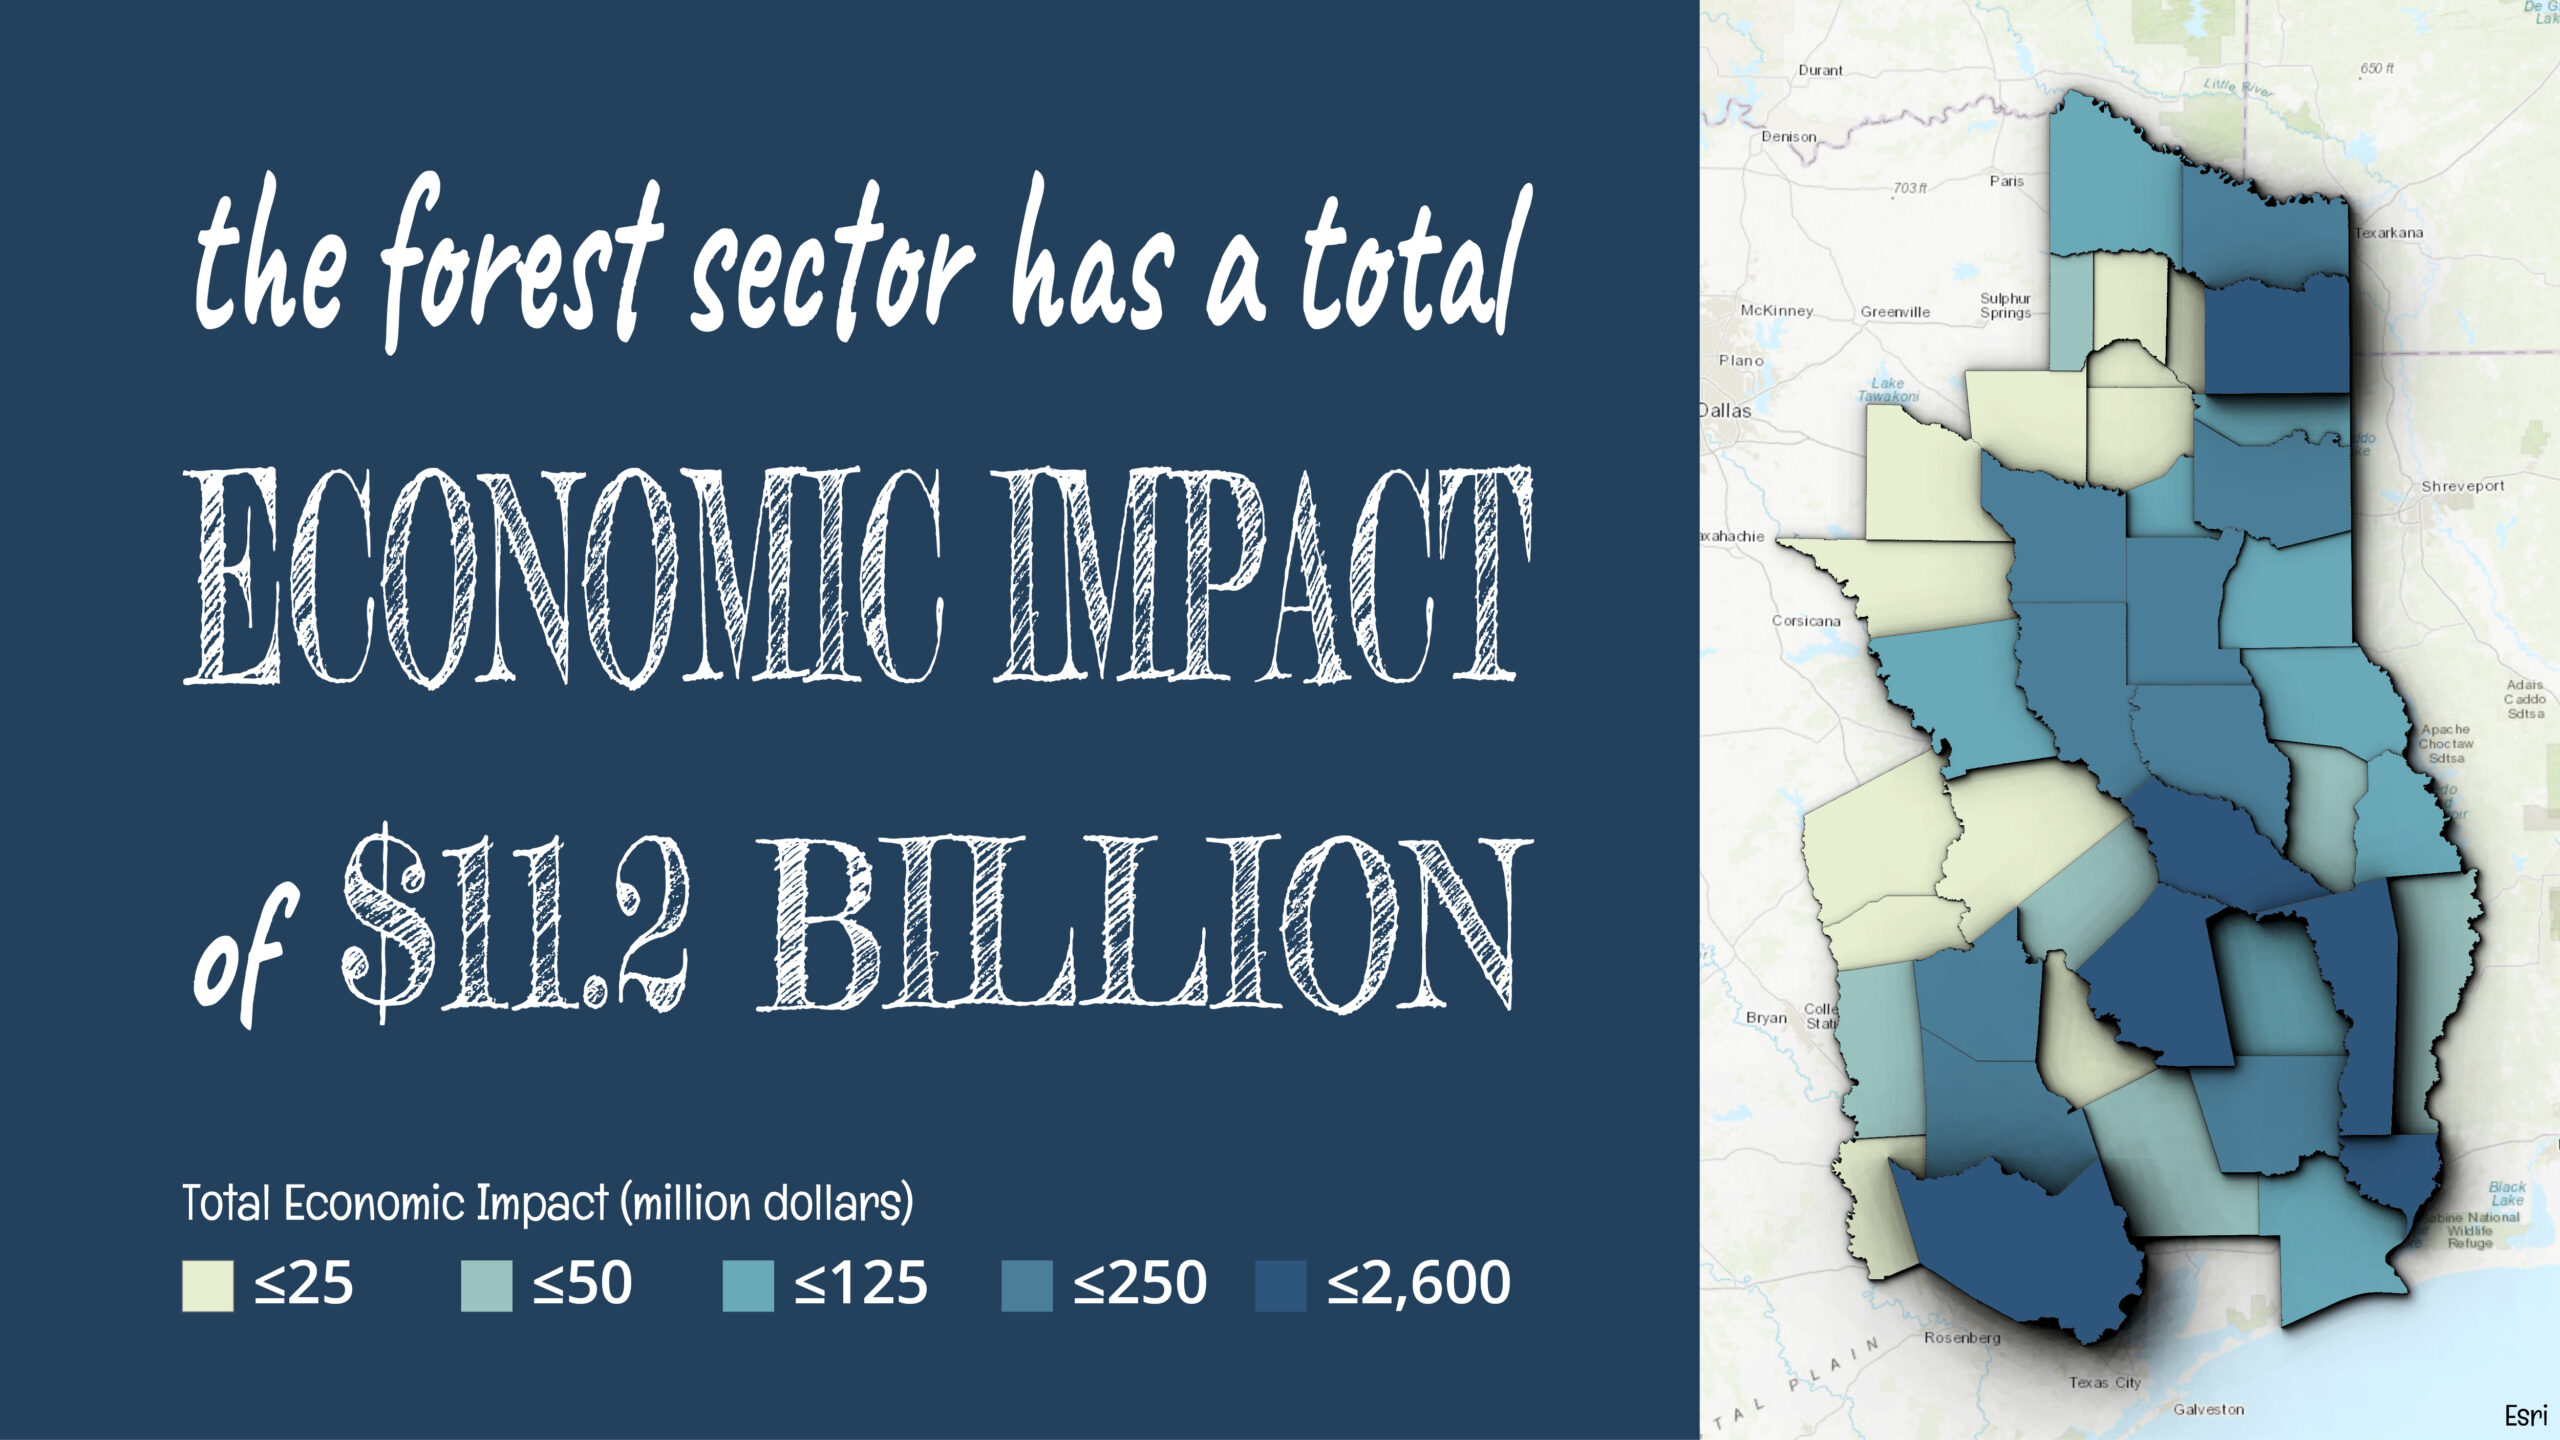
The forest industry is an important part of the East Texas economy. This map shows the total economic contribution by county in 2015. The forest sector in the 43-county region had a total economic impact of $11.2 billion in industry output, supporting over 47,500 jobs with a payroll of $2.9 billion. Explore the Texas Forest Sector Economic Impact tools to learn more.

Choropleth maps are often used to show quantities of county (or other polygon) attributes spatially. They divide the values into classes and assign a color to each class, usually in a gradation. One of the problems with choropleth maps is that you can’t see any of the within-class variability — all members of a class, no matter how big the class, appear the same. Illuminating a choropleth helps overcome this issue. An illuminated choropleth map uses soft shadows to add depth based on the map units’ values, so in addition to the color classes, you can see relative differences between units within the same class.
The technique used for this map was based on Steward and Kennelly’s “Illuminated Choropleth Maps,” using Field and Beale’s Terrain Tools for ArcGIS.