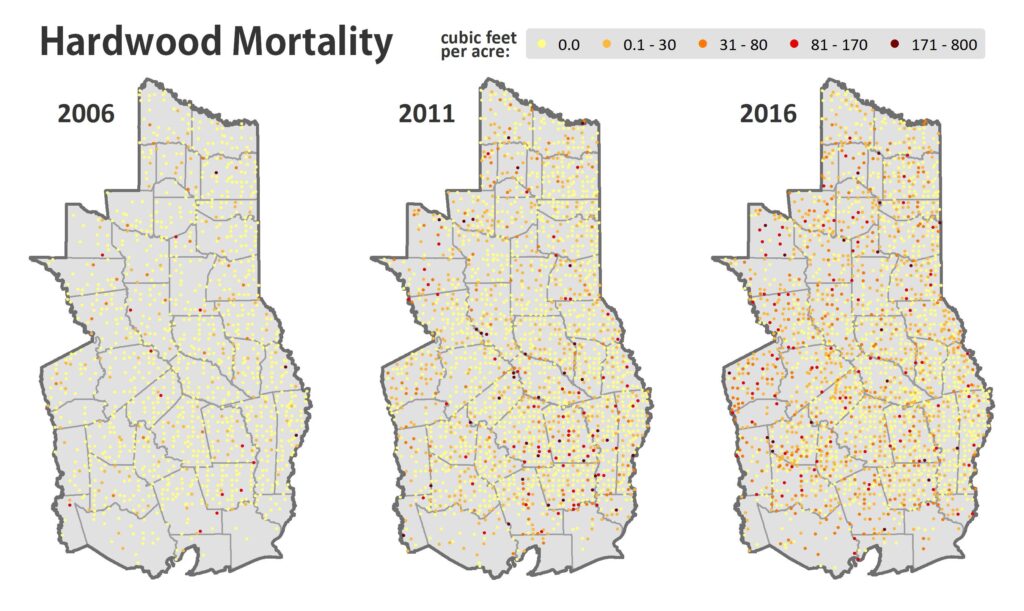
These maps show Forest Inventory and Analysis (FIA) plots from the 2006, 2011, and 2016 inventories. In East Texas, 20 percent of an inventory’s plots are measured each year, so for example, the 2016 inventory contains data collected from 2012 to 2016. The first annual inventory was completed in 2003. Since mortality is a change measurement, it requires plots that have been re-measured to estimate. This means that the 2006 inventory shown here is really only 60 percent of a full inventory, those plots that were re-measured in 2004, 2005, and 2006. This is why there are fewer dots on the 2006 map. However, they are representative of the area, so while it is not valid to compare the numbers of plots in 2006 to 2011 and 2016, it is okay to compare the relative amounts and overall estimates of mortality with 2011 and 2016. Mortality shown is of hardwood trees at least five inches in diameter on all forest types, expressed in cubic feet per acre.

Mortality of hardwood trees in East Texas has increased substantially over the past several years. The rate of increase is tapering, but mortality is simultaneously becoming more widespread. In 2011, mortality was more intense at select locations than in 2016, with a maximum occurrence of 800 cubic feet per acre in 2011 versus a max of 400 cubic feet per acre in 2016. However, total mortality was higher in 2016 than in 2011 — 213 million cubic feet in 2016 versus 169 million cubic feet in 2011 — with nearly 50 percent of forested plots experiencing some level of hardwood mortality in 2016 versus 35 percent in 2011. This means hardwood mortality is more diffuse now than it was five years ago — rather than being concentrated in a few areas, it is spread out over much of East Texas. This is consistent with the type of disturbance we’ve seen recently; the impact of the 2011 drought was felt across the region, unlike a discrete wind event that might take out all or most of the trees in a relatively smaller area.
Looking at hardwood mortality by cause of death, we see that much of the increase is due to weather — hurricanes and drought. Disease mortality has risen in the past few years, possibly due to weakened disease resistance caused by drought stress. This seems especially likely given the corresponding drop in mortality attributed to weather. Trees re-measured a few years after the drought might be more likely to be assigned ‘disease’ as cause of death than ‘drought.’
Keep in mind that since 20 percent of the data is measured each year, the 2016 numbers represent trees that died between 2012 and 2016. This also means that for any two consecutive years, 80 percent of the data is the same.