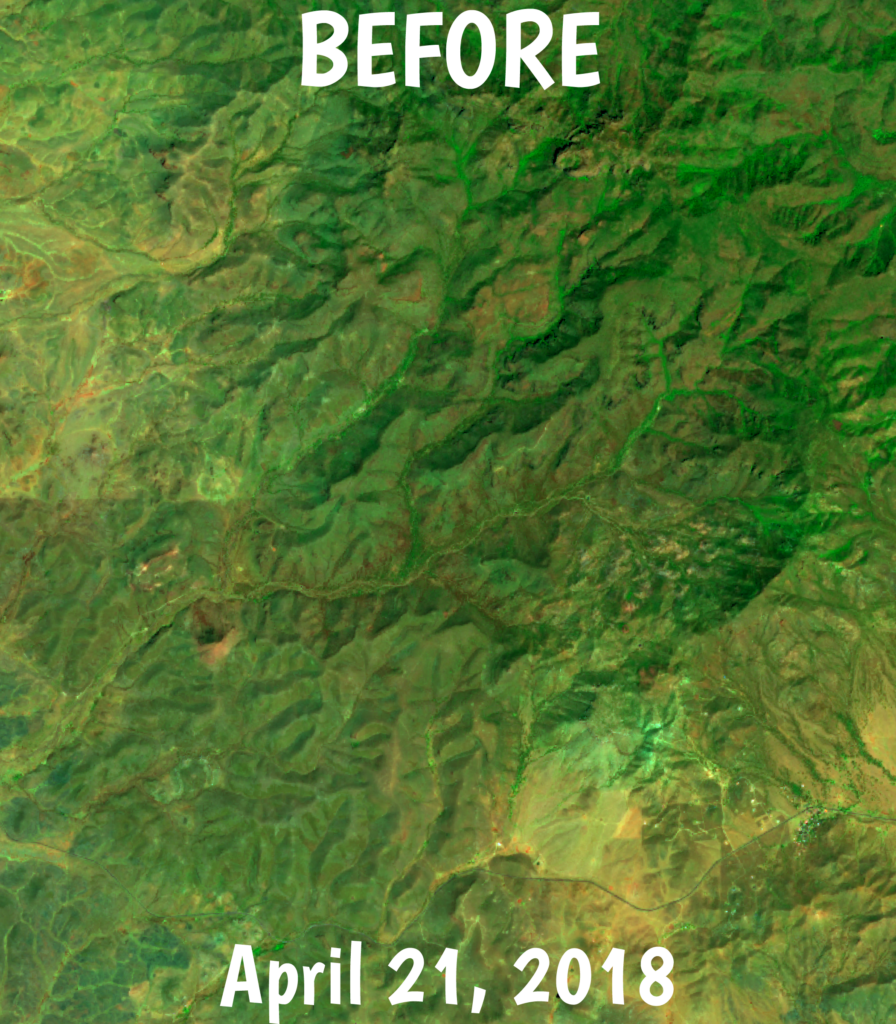
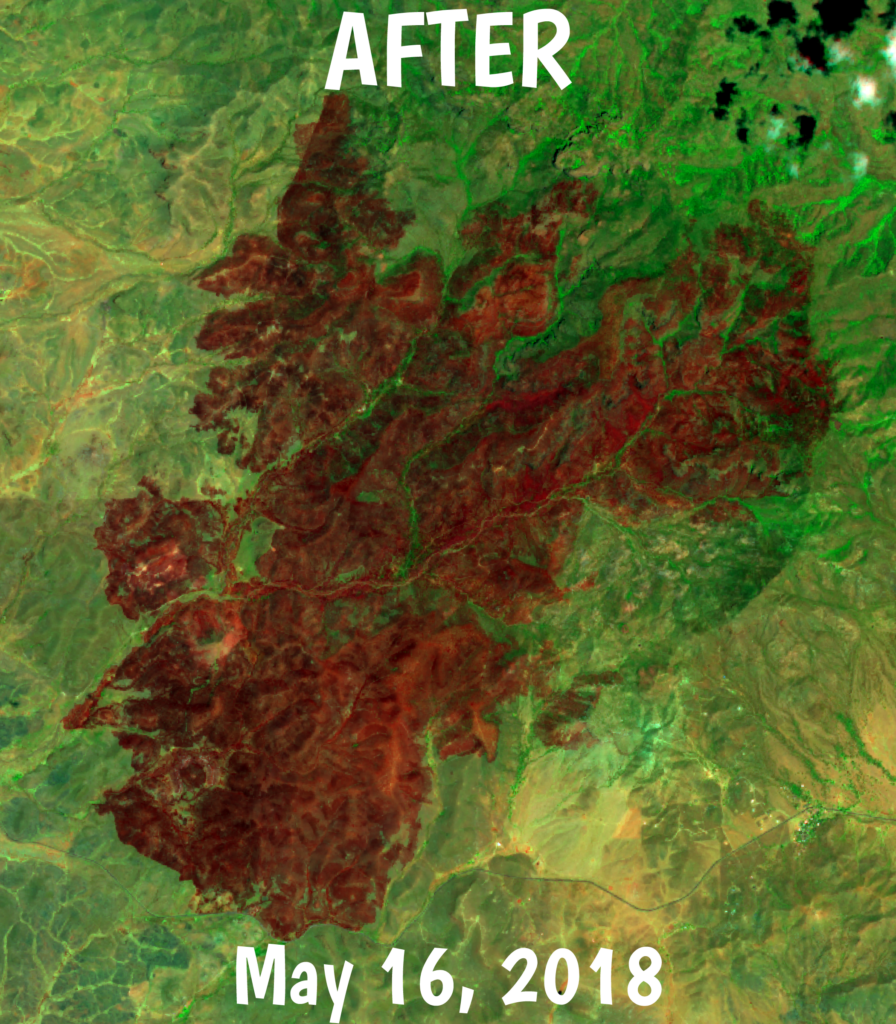
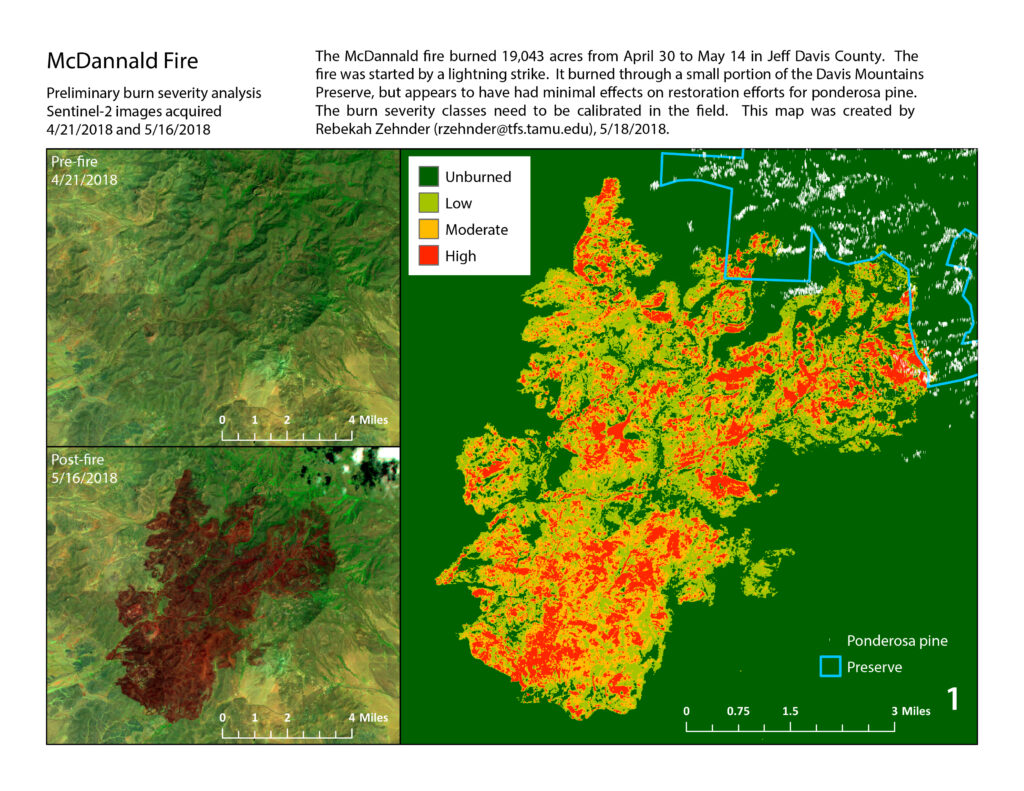
The McDannald fire burned 19,043 acres from April 30 to May 14 in Jeff Davis County. The fire was started by a lightning strike. The starkness of the burned area stands out in a satellite image showing shortwave infrared and near infrared. For more on how we trick our eyes into seeing more in satellite imagery, see January’s map.


We use the before and after images to calculate what’s known as a normalized burn ratio. The computation compares the values of the shortwave infrared band and the near infrared band. Healthy vegetation has low shortwave infrared values and high near infrared values. Burned vegetation has the opposite — high shortwave infrared values and low near infrared values. So comparing them gives a good indication of burn severity. We take the difference between the pre-fire NBR and the post-fire NBR to get a map of burn severity. This helps guide recovery efforts, as it shows the areas with the heaviest damage to vegetation.

The images used in this analysis were acquired by the European Union’s Sentinel-2 satellite on April 21, 2018 and May 16, 2018. Sentinel-2 has a relatively high repeat collection rate of 5 days — meaning it returns to the same location every 5 days — which helps our chances of getting a cloud-free image in the right timeframe.
Want to learn more about burn severity mapping? Check out these resources:
- Normalized Burn Ratio (Humboldt State University)
- Monitoring Trends in Burn Severity (USGS, USFS and USDOI)