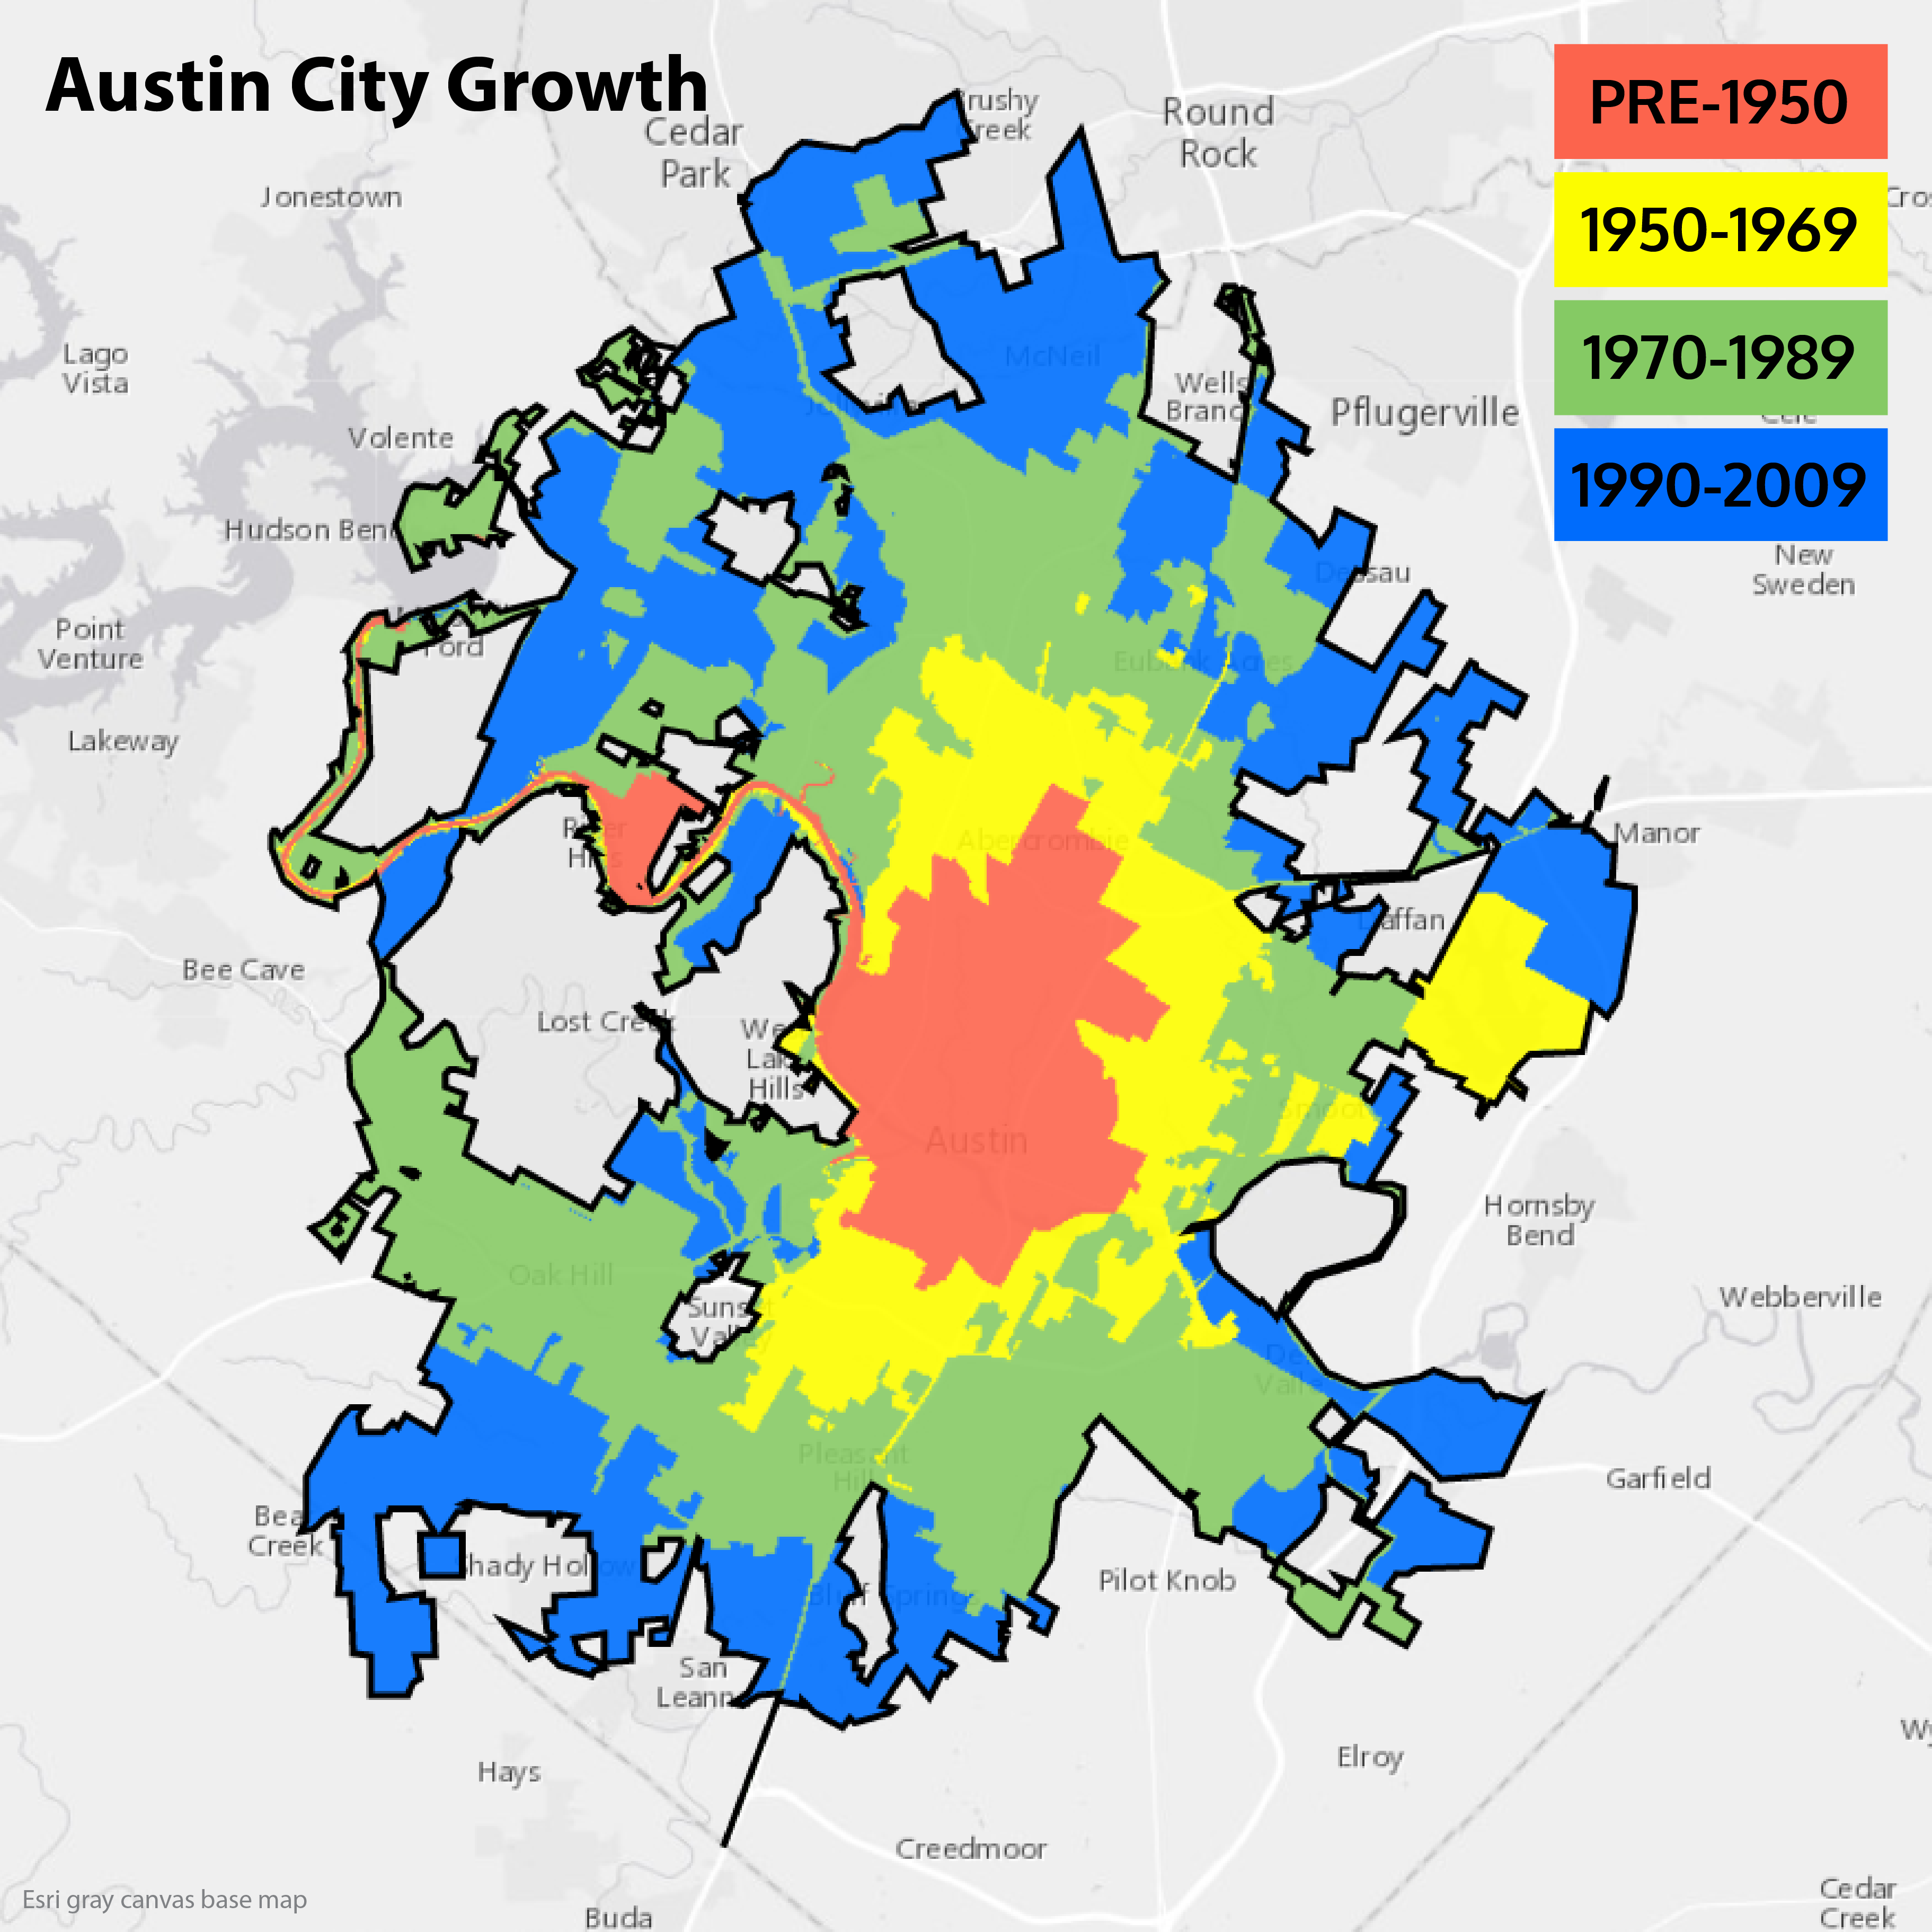
Map-making doesn’t always have to be complicated. This map that shows the growth of Austin over the past 60 years is simply a screen clipping from a website with some text added to it. The orange-ish color is what comprised Austin as of December 31, 1949. The yellow parts were annexed in the 1950s and 60s, green in the 70s and 80s, and blue in the last two decades. The map was clipped from My City’s Trees, a web application that interactively displays urban forest data. My City’s Trees lets you break down city-wide forest information into interesting segments. For example, we can see that four percent of trees and 12 percent of the carbon stored in trees in Austin is in pre-1950 historical Austin. For reference, we can also see that the pre-1950 portion of the city covers 11 percent of the total area and is home to 18 percent of the population.
The forest data that underlies My City’s Trees comes from Urban Forest Inventory & Analysis, a U.S. Forest Service and Texas A&M Forest Service partnership to collect, analyze, and report data on the quality, health, composition, and benefits of urban trees and forests. Visit My City’s Trees to explore urban forest inventory data.